
Download Power BI Desktop – data visualization, business intelligence, analytics, reporting tool, dashboard creation, data analysis, real-time insights, interactive dashboards, data modeling, data transformation
Overview
Power BI Desktop is a powerful data analysis and visualization tool developed by Microsoft, designed to empower businesses and professionals with the ability to transform raw data into actionable insights. The application serves as a foundational component of the broader Power BI ecosystem, enabling users to connect to diverse data sources, perform advanced data modeling, and create interactive dashboards for real-time decision-making. It is particularly valuable for data analysts, business intelligence teams, and decision-makers seeking to streamline reporting processes and improve organizational transparency through data-driven strategies.
The tool addresses common challenges in data integration, such as handling disparate data formats, ensuring data accuracy, and enabling collaborative reporting across departments. By centralizing data preparation and visualization within a single desktop environment, Power BI Desktop reduces the complexity often associated with managing analytics workflows. Its primary users include corporate analysts, finance teams, marketing strategists, and IT professionals who require robust tools for data transformation and reporting.
As part of Microsoft’s enterprise-grade suite of analytics tools, Power BI Desktop benefits from strong integration with other Microsoft services such as Azure, Excel, and SQL Server. The developer, Microsoft, brings a proven track record in enterprise software, ensuring reliability, scalability, and long-term support. Although the developer did not provide additional technical details, the application’s release date of April 11, 2024, indicates it is actively maintained and updated to meet evolving business needs.
Real-world use cases include monitoring sales performance across regions, tracking customer behavior trends, and generating financial forecasts. In the broader app ecosystem, Power BI Desktop plays a critical role in bridging the gap between raw data and strategic business decisions, making it an essential utility for modern data-centric organizations.
Key Features & Functionality
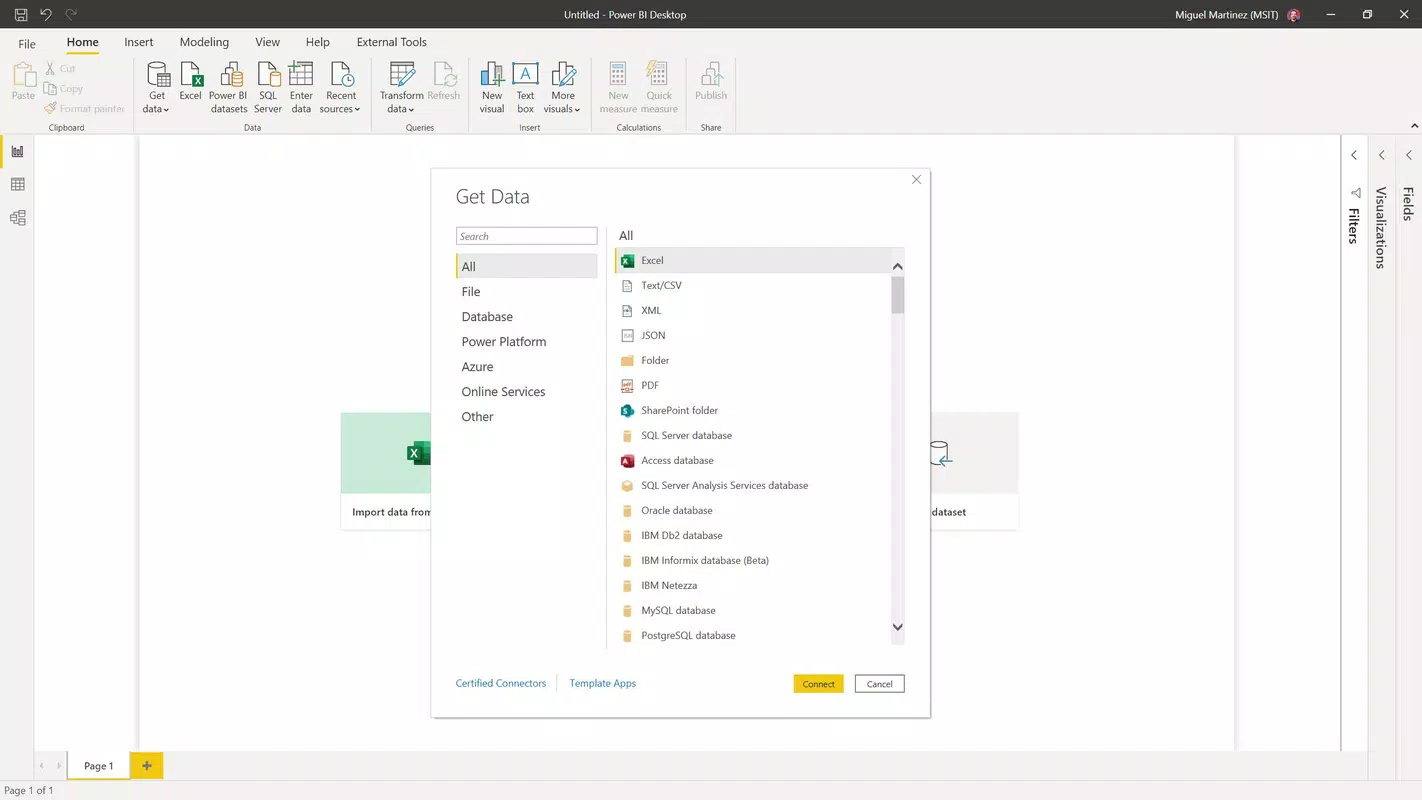
Power BI Desktop offers a comprehensive suite of features tailored to advanced data analysis and visualization. Users can connect to a wide range of data sources, including Excel files, SQL Server databases, cloud services like SharePoint and Azure, and web APIs. This connectivity enables seamless data ingestion, allowing users to consolidate information from multiple systems into a unified analytical workspace.
- Data Modeling: Users can define relationships between tables, create calculated columns, and build measures using DAX (Data Analysis Expressions), enabling complex business logic and dynamic calculations.
- Data Transformation: The Power Query Editor provides a visual interface for cleaning, filtering, merging, and reshaping data, ensuring high-quality input for analysis.
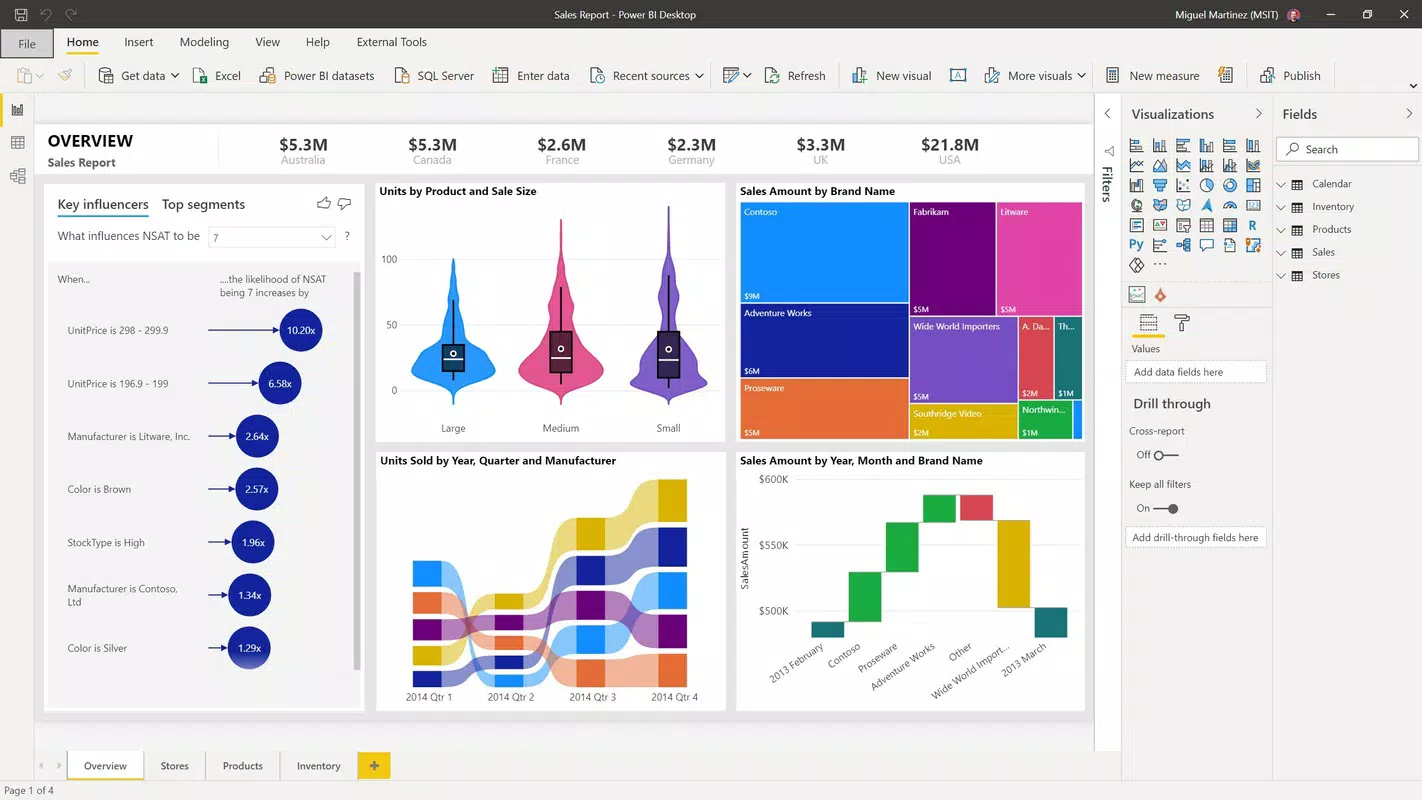
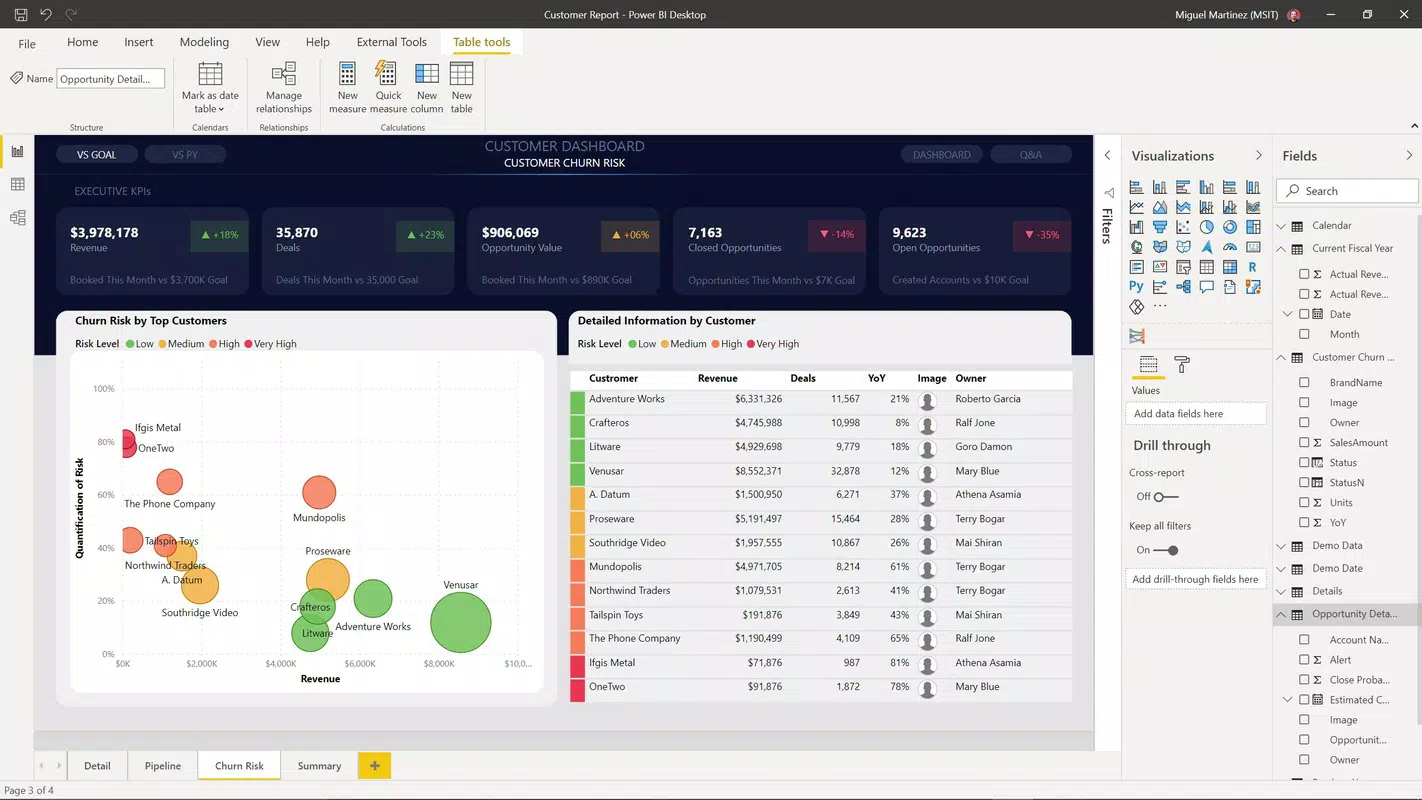
- Interactive Dashboard Creation: Users can design dynamic, interactive dashboards with drill-through capabilities, slicers, and conditional formatting to explore data from multiple angles.
- Real-Time Insights: By leveraging live connections to data sources, dashboards can reflect up-to-date information, supporting timely decision-making.
- Export and Sharing Options: Reports can be published to the Power BI service for collaboration, or exported as PDFs and images for presentations.
For example, a retail analyst might use Power BI Desktop to merge sales data from multiple stores, clean inconsistencies in product categories, model customer purchase patterns, and visualize monthly revenue trends through an interactive dashboard. This workflow enhances transparency and enables leadership to identify growth opportunities quickly. The tool’s functionality is especially beneficial for teams that require precision, scalability, and reproducibility in their reporting processes.
Interface, UX & Performance
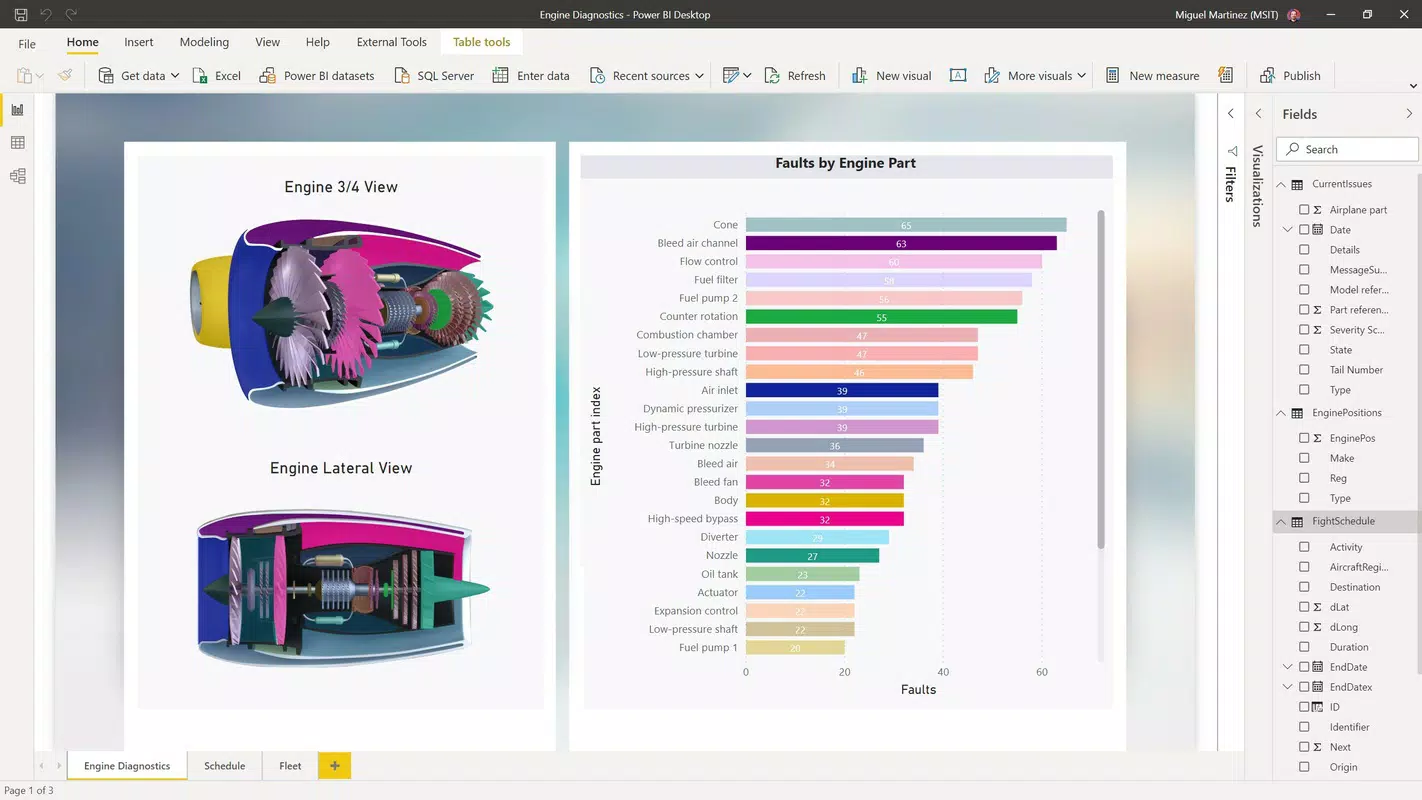
Power BI Desktop features a clean, intuitive interface designed for both technical and non-technical users. The layout is organized into clearly labeled panes: the Fields pane for data selection, the Visualizations pane for designing charts and graphs, and the Report view for constructing dashboards. Navigation is straightforward, with a ribbon menu offering quick access to core functions such as data refresh, formatting, and publishing.
The visual style is minimalistic and professional, emphasizing data clarity over decorative elements. Users can customize themes and apply consistent branding across reports, which enhances presentation quality for internal and external stakeholders. The application supports responsive design, meaning dashboards adapt well to different screen sizes, although specific performance benchmarks were not disclosed.
Although the developer did not list formal performance metrics, the application is optimized for handling large datasets, with efficient memory management and incremental refresh capabilities. Users can expect stable operation across mid-to-high-end Windows devices, with minimal lag during data modeling and visualization tasks. On lower-end systems, performance may vary depending on data volume and hardware specifications.
Stability is maintained through regular updates, and the application generally maintains consistent behavior during extended usage. The user experience is enhanced by tooltips, contextual help, and built-in templates that accelerate report creation. Overall, Power BI Desktop delivers a reliable and productive environment for data professionals seeking a robust desktop analytics solution.
Platform Compatibility & Technical Requirements
Power BI Desktop is available exclusively for the Windows platform. It requires a Windows operating system, though the specific minimum version was not listed by the developer. The application has a file size of 256.6 MB, indicating a relatively lightweight installation that does not impose significant storage demands on most modern systems.
The current software version is 2.140.1058.0, released on April 11, 2024. This suggests ongoing development and regular feature enhancements. While compatibility with older Windows versions was not fully disclosed, the application is expected to support recent Windows releases, including Windows 10 and Windows 11, based on Microsoft’s standard deployment practices.
Users should ensure their system meets general requirements for running desktop applications, such as sufficient RAM and a stable internet connection for data connectivity. Specific hardware or driver requirements were not provided. The absence of mobile or macOS versions means that users must rely on the desktop application for full functionality, though cloud-based Power BI services offer mobile access through other apps.
Pros and Cons
Pros
- Free to download and use, making it accessible for individuals and small teams.
- Powerful data modeling and transformation tools for advanced analytics.
- Seamless integration with Microsoft ecosystem services.
- Supports real-time data connections and interactive dashboards.
- Regular updates with new features and improvements.
Cons
- Available only on Windows, limiting cross-platform access.
- No native support for macOS or mobile devices.
- Requires some learning curve for new users unfamiliar with DAX or Power Query.
- Performance may be affected on low-end hardware with large datasets.
- Advanced features require a Power BI Pro or Premium license when publishing to the cloud.
FAQ
Is Power BI Desktop free to use?
Yes, Power BI Desktop is available at no cost. It is a free tool provided by Microsoft for data analysis, modeling, and dashboard creation.
Can I use Power BI Desktop on macOS or mobile devices?
Power BI Desktop is currently only available for Windows. While Microsoft offers Power BI mobile apps for iOS and Android, they are separate from the desktop application and do not include all desktop features.
What data sources can I connect to in Power BI Desktop?
Users can connect to a wide variety of data sources, including Excel files, SQL Server, Azure, SharePoint, web APIs, and cloud services. The exact list may vary depending on the version and installed connectors.
Do I need a Power BI license to publish reports?
While Power BI Desktop itself is free, publishing reports to the Power BI service requires a Power BI Pro or Premium license, depending on the intended audience and collaboration needs.
How often is Power BI Desktop updated?
Microsoft regularly releases updates to Power BI Desktop. The latest version, 2.140.1058.0, was released on April 11, 2024, indicating consistent maintenance and feature development.
Final Thoughts + CTA
Power BI Desktop stands out as a robust, feature-rich tool for professionals who need to transform complex data into meaningful visual insights. Its combination of powerful data modeling, transformation, and visualization capabilities makes it a top choice for business intelligence teams and data analysts. While its exclusive availability on Windows may limit accessibility for some users, its free pricing and deep integration with Microsoft’s ecosystem make it a compelling option for organizations already invested in the platform.
Whether you're building real-time dashboards, analyzing sales trends, or conducting in-depth data modeling, Power BI Desktop delivers a professional-grade experience without cost barriers. For those seeking a secure, reliable, and scalable analytics solution, this tool offers unmatched value in the productivity and data analysis space.
Download Power BI Desktop now


